Excel in your academics by accessing McGraw Hill Math Grade 3 Answer Key PDF Chapter 10 Test existing for free of cost.
McGraw-Hill Math Grade 3 Chapter 10 Test Answer Key
Question 1.
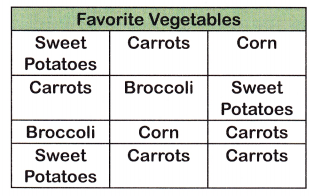
Make a tally chart to show the data in this table.
DRAWING OF TALLY CHART
Answer:
Number of sweet potatoes = 3
Number of carrots = 5
Number of corn = 2
Number of Broccoli = 2
| Favorite Vegetables | Tally Marks |
| Sweet Potatoes | ||| |
| Carrots | |
| Corn | || |
| Broccoli | || |
Question 2.
Did fewer people choose carrots and broccoli or sweet potatoes and corn as their favorite vegetables?
Answer:
People choose carrots and broccoli = 5 + 2 = 7
People choose sweet potatoes and corn = 3 + 2 = 5
Thus fewer people chose sweet potatoes and corn as their favorite vegetables.
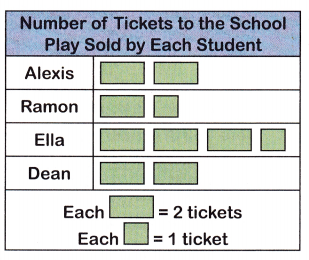
Use the picture graph for Exercises 3 and 4.
Question 3.
Who sold 4 tickets?
Answer:
Each rectangular block = 2 tickets
From the table, we can see that
Alexis uses = 2 × 2 = 4 tickets
Question 4.
How many more tickets did Ella sell than Ramon?
Answer:
Ella sell = 2 + 2 + 2 + 1 = 7 tickets
Ramon sell = 2 + 1 = 3
7 – 3 = 4
Ella sell 4 tickets more than Ramon.
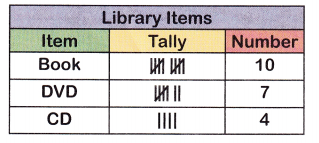
Mr. Owens asked his students, “What was the last kind of item you checked out from the library?” The tally chart shows their responses.
Question 5.
What kind of item was checked out more often than CDs but less often than books?
Answer:
Number of books checked = 10
Number of CDs checked = 4
10 – 4 = 6
Use the bar graph to answer the questions.
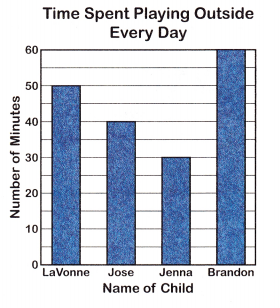
Question 6.
How many fewer minutes does LaVonne play outside than Brandon?
Answer:
LaVonne played for 50 minutes
Bradon played for 60 minutes
60 – 50 = 10
LaVonne played 10 minutes less than Brandon.
Question 7.
How many more minutes does Brandon play outside than Jose?
Answer:
Bradon played for 60 minutes
Jose played for 40 minutes
60 – 40 = 20 minutes
Thus Brandon played 20 more minutes than Jose.
Question 8.
Does Jose or Jenna spend more time playing outside? How can you tell even without looking at the scale?
Answer:
Jenna played for 30 minutes
Jose played for 40 minutes
Compared to Brandon Jose or Jenna does not spend more time playing outside.
The table shows how many loaves of different kinds of bread a bakery sold in one day.
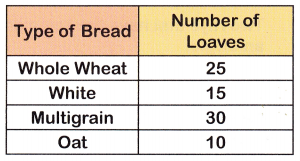
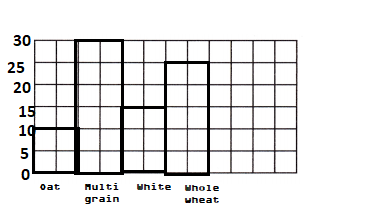
Question 9.
Use the grid to draw a bar graph to show the data. Use multiples of 5 for the scale.
Answer:
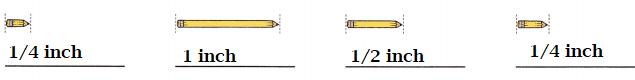
Use a ruler to measure the length to the nearest \(\frac{1}{2}\) inch or \(\frac{1}{4}\) inch. Write the lengths.
Question 10.

Answer: