Excel in your academics by accessing McGraw Hill Math Grade 3 Answer Key PDF Chapter 10 Lesson 5 Drawing a Bar Graph existing for free of cost.
McGraw-Hill Math Grade 3 Answer Key Chapter 10 Lesson 5 Drawing a Bar Graph
Draw
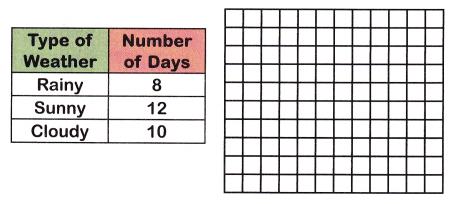
Use the table to draw a bar graph.
Question 1.
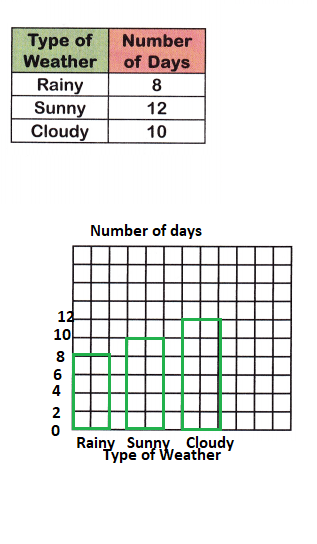
Rico kept track of the weather for one month. The table shows the data. Use this data to draw a bar graph on the grid. Each grid line should stand for multiples of 2.
Answer:
By using the data given in the above table we can draw the bar graph for the type of weather and number of days.