Excel in your academics by accessing McGraw Hill Math Grade 3 Answer Key PDF Chapter 10 Lesson 1 Making a Tally Chart existing for free of cost.
McGraw-Hill Math Grade 3 Answer Key Chapter 10 Lesson 1 Making a Tally Chart
Tally
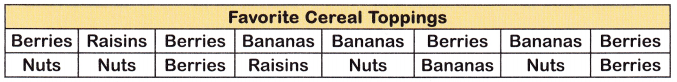
Use the data in the table for the exercises.
Question 1.
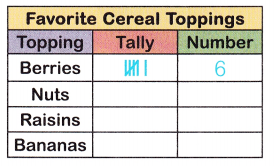
Complete the tally chart to show the data.
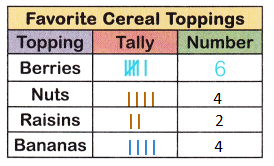
Answer:
Data from the above table are as follows,
There are 6 berries, 4 nuts, 2 Raisins, 4 Bananas
With the help of the data, we can draw the tally marks.
Question 2.
Which topping got the most votes?
Answer:
From the data given in the above table, we can say that Berries got the most votes.
Question 3.
How many more people chose nuts than raisins?
Answer:
There are 2 Raisins and 4 Nuts.
4 – 2 = 2
Thus 2 more people chose nuts than raisins.