Practice questions available in McGraw Hill Math Grade 2 Answer Key PDF Chapter 9 Lesson 4 Using a Bar Graph to Compare Data will engage students and is a great way of informal assessment.
McGraw-Hill Math Grade 2 Answer Key Chapter 9 Lesson 4 Using a Bar Graph to Compare Data
Solve
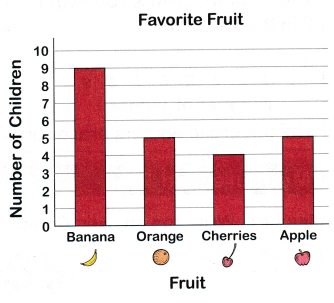
Use the graph to help you answer the questions. This graph shows the fruit children in one class like best.
Question 1.
How many more Favorite Fruit children liked bananas than liked apples?
Answer:
4 children
Explanation:
The above graph shows the fruit children in one class like best
9 children like banana
5 children like apple
Subtract to find
9 – 5 = 4
So, 4 more favorite fruit children liked bananas than liked apples.
Question 2.
How many children did not choose oranges as their favorite fruit?
Answer:
18 children
Explanation:
The above graph shows the fruit children in one class like best
9 children like banana
4 children like cherries
5 children like apple
Add to find
9 + 4 + 5 = (9 + 4) + 5
= 13 + 5 = 18
So, 18 children did not chose oranges as their favorite fruit.