Practice questions available in McGraw Hill Math Grade 2 Answer Key PDF Chapter 9 Lesson 2 Drawing a Bar Graph will engage students and is a great way of informal assessment.
McGraw-Hill Math Grade 2 Answer Key Chapter 9 Lesson 2 Drawing a Bar Graph
Draw
Read. Complete the bar graph.
Question 1.
In the vase are red, yellow, and blue flowers.
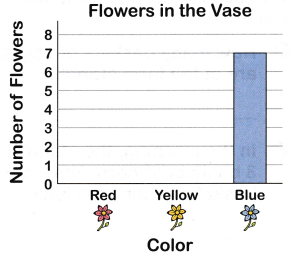
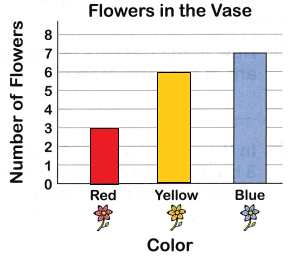
There are 7 blue flowers, 3 red flowers, and 6 yellow flowers. Draw bars on the graph to show the numbers of flowers in the vase.
Answer:
Explanation:
In the vase are red, yellow, and blue flowers
There are 7 blue flowers, 3 red flowers, and 6 yellow flowers
So, i drew bars on the graph to represent the number of flowers in the vase.