
Who doesn’t love the best learning? Go, Math Grade, 8 Answer Key Chapter 15 Two-Way Tables is the perfect guide for every student to learn maths. The explanation also included along with the questions and answers where students can easily understand the method of solving math questions. Students can habituate practice maths if they start their practice with the Go Math Grade 8 Chapter 15 Two-Way Tables Solution Key. Don’t look anymore. Make your students learn the maths using Go Math Grade 8 Answer Key.
Go Math Grade 8 Chapter 15 Two-Way Tables Answer Key
Go Math Grade 8 Answer Key Chapter 15 Two-Way Tables offering the best way to practice maths with easy tricks and tips. So, every student loves to learn maths in an easy way. You can download and practice Go Math Grade 8 Text Book questions for free. Free PDF of HMH Go Math Grade 8 Answer Key is provided for the students here.
Lesson 1: Two-Way Frequency Tables
Lesson 2: Two-Way Relative Frequency Tables
Model Quiz
Mixed Review
Guided Practice – Two-Way Frequency Tables – Page No. 454
Question 1.
In a survey of 50 students, 60% said that they have a cat. Of the students who have a cat, 70% also have a dog. Of the students who do not have a cat, 75% have a dog. Complete the two-way table.
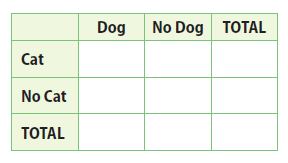
a. Enter the total number of students surveyed in the bottom right cell of the table.
Type below:
_______________
Answer:
Explanation:
In a survey of 50 students, 60% said that they have a cat.
In mathematical terms:
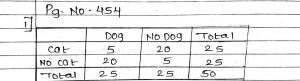
Cat = 0.6×50 = 30
If 60% have a cat, then 40% don’t have a cat
No Cat = (1 – 0.6) × 50 = 20
Because there are 2 options, Adding them will give the total amount of students
Total = Cat + No Cat = 50
Of the students who have a cat, 70% also have a dog. Of the students who do not have a cat, 75% have a dog. So, in mathematical terms:
Dog = Cat × 0.7 + No Cat ×0.75 = 30 × 0.7 + 20 × 0.75 = 36
Following the same logic as before, if 70% of students who have a cat also have a dog, then 30% of them don’t have a dog. The same analysis for the students who do not have a cat.
No Dog = Cat × (1-0.7) + No Cat × (1-0.75) = 30 × (1-0.7) + 20 × (1-0.75) = 14
Again, the addition of the 2 options has to give the total amount of students
Total = 50
Question 1.
b. Fill in right column.
Type below:
_______________
Answer:
Of the students who have a cat, 70% also have a dog. Of the students who do not have a cat, 75% have a dog. In mathematical terms:
Dog = Cat × 0.7 + No Cat ×0.75 = 30 × 0.7 + 20 × 0.75 = 36
Question 1.
c. Fill in top row.
Type below:
_______________
Answer:
In a survey of 50 students, 60% said that they have a cat. In mathematical terms:
Cat = 0.6×50 = 30
Question 1.
d. Fill in second row.
Type below:
_______________
Answer:
If 60% have a cat, then 40% don’t have a cat
No Cat = (1 – 0.6) × 50 = 20
Question 1.
e. Fill in last row.
Type below:
_______________
Answer:
Because there are 2 options, the addition of them has to give the total amount of students
Total = Cat + No Cat = 50
Question 2.
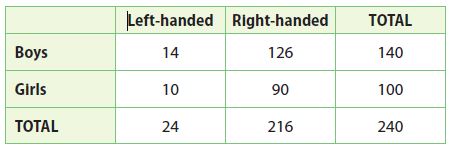
The results of a survey at a school are shown. Is there an association between being a boy and being left-handed? Explain.
_______________
Answer:
No, there isn’t any association between being a boy and being left-handed.
Boys are no more likely to be left-handed than right-handed.
ESSENTIAL QUESTION CHECK-IN
Question 3.
Voters were polled to see whether they supported Smith or Jones. Can you construct a two-way table of the results? Why or why not?
_______________
Answer:
You cannot construct a two-way table of the results. Because there is only one variable; voters. If there were two variables, such as men and women, a two-way table could be constructed.
15.1 Independent Practice – Two-Way Frequency Tables – Page No. 455
Question 4.
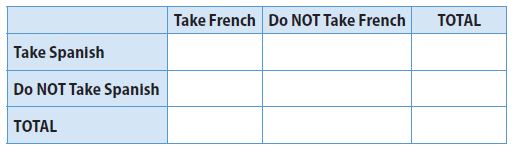
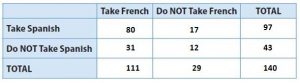
Represent Real-World Problems One hundred forty students were asked about their language classes. Out of 111 who take French, only 31 do not take Spanish. Twelve take neither French nor Spanish. Use this information to make a two-way table.
Type below:
_______________
Answer:
Question 5.
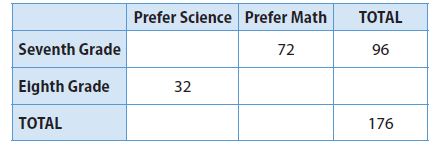
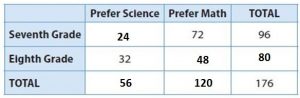
Represent Real-World Problems Seventh- and eighth-grade students were asked whether they preferred science or math.
a. Complete the two-way table.
Type below:
_______________
Answer:
Question 5.
b. Is there an association between being in eighth grade and preferring math? Explain.
_______________
Answer:
There is no association as such between being in eighth grade and preferring maths. But due to the total no. of eighth-grade students choosing maths is greater than the total no. of students in seventh grade preferring science. So, the eighth-grade students preferred.
Question 6.
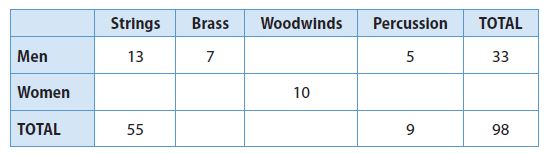
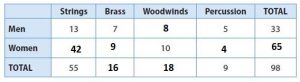
Persevere in Problem Solving The table gives partial information on the number of men and women who play in the four sections of the Metro Orchestra.
a. Complete the table.
Type below:
_______________
Answer:
Question 6.
b. Is there an association between being a woman and playing strings? Explain.
_______________
Answer:
There is no association between being a woman and playing strings since the number of men playing string is less than women.
Two-Way Frequency Tables – Page No. 456
FOCUS ON HIGHER ORDER THINKING
Question 7.
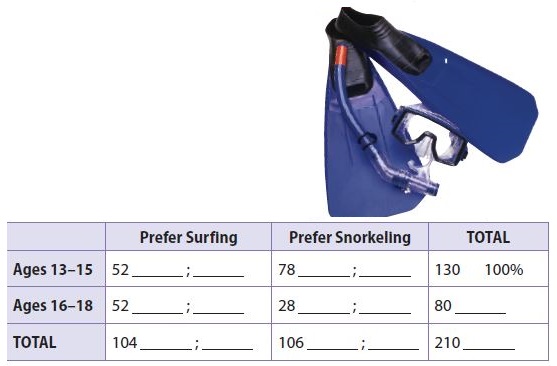
Multi-Step The two-way table below shows the results of a survey of Florida teenagers who were asked whether they preferred surfing or snorkeling.
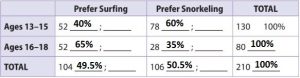
a. To the right of the number in each cell, write the relative frequency of the number compared to the total for the row the number is in. Round to the nearest percent.
Type below:
_______________
Answer:
Question 7.
b. Explain the meaning of the relative frequency you wrote beside 28.
Type below:
_______________
Answer:
The relative frequency shows the percentage of people aged 16-18 that prefer snorkeling.
Question 7.
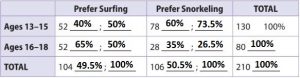
c. To the right of each number you wrote in part a, write the relative frequency of each number compared to the total for the column the number is in. Are the relative frequencies the same? Why or why not?
Type below:
_______________
Answer:
Question 7.
d. Explain the meaning of the relative frequency you wrote beside 28.
Type below:
_______________
Answer:
The relative frequency represents the percentage of people that prefer snorkeling that is aged 16-18.
Guided Practice – Two-Way Relative Frequency Tables – Page No. 462
Question 1.
In a class survey, students were asked to choose their favorite vacation destination. The results are displayed by gender in the two-way frequency table.
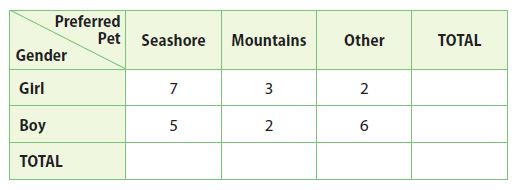
a. Find the total for each gender by adding the frequencies in each row. Write the row totals in the Total column.
Type below:
_______________
Answer:
Girl = 7 + 3 + 2 = 12
Boy = 5 + 2 + 6 = 13
Question 1.
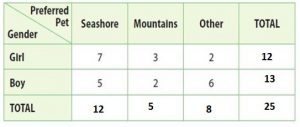
b. Find the total for each preferred vacation spot by adding the frequencies in each column. Write the column totals in the Total row.
Type below:
_______________
Answer:
Seashore = 7 + 5 = 12
Mountains = 3 + 2 = 5
Other = 2 + 6 = 8
Question 1.
c. Write the grand total (the sum of the row totals and the column totals) in the lower-right corner of the table.
Type below:
_______________
Answer:
grand total = 25
Question 1.
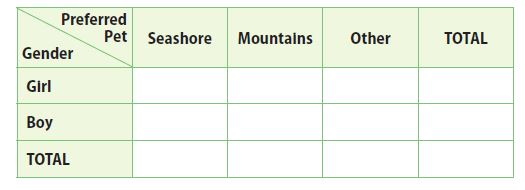
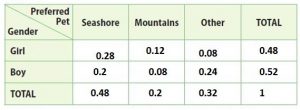
d. Create a two-way relative frequency table by dividing each number in the above table by the grand total. Write the quotients as decimals.
Type below:
_______________
Answer:
Explanation:
7/25 = 0.28, 3/25 = 0.12; 2/25 = 0.08; 12/25 = 0.48
5/25 = 0.2; 2/25 = 0.08; 6/25 = 0.24; 13/25 = 0.52
12/25 = 0.48; 5/25 = 0.2; 8/25= 0.32; 25/25 = 1
Question 1.
e. Use the table to find the joint relative frequency of students surveyed who are boys and who prefer vacationing in the mountains.
_________
Answer:
Joint relative frequency of boys = 2/25 = 0.08
These boys who prefer vacationing in the mountains.
Question 1.
f. Use the table to find the marginal relative frequency of students surveyed who prefer vacationing at the seashore.
_________
Answer:
The marginal relative frequency of studnets = 12/25 = 0.48
These are the number of students who prefer vacationing in the seashore.
Question 1.
g. Find the conditional relative frequency that a student surveyed prefers vacationing in the mountains, given that the student is a girl. Interpret this result.
_________
Answer:
The condition relative frequency of girls of row = 3/12 = 0.25
And that of the column is 3/5 = 0.6
These are the number of girls who preferred vacationing in the mountains.
ESSENTIAL QUESTION CHECK-IN
Question 2.
How can you use a two-way frequency table to learn more about its data?
Type below:
_______________
Answer:
The two-way frequency table gives perfection and accuracy in calculating the data. It helps to calculate the total value two times while calculating the data of the row and to calculate the data of the column.
15.2 Independent Practice – Two-Way Relative Frequency Tables – Page No. 463
Stefan surveyed 75 of his classmates about their participation in school activities as well as whether they have a part-time job. The results are shown in the two-way frequency table. Use the table for Exercises 3–6.
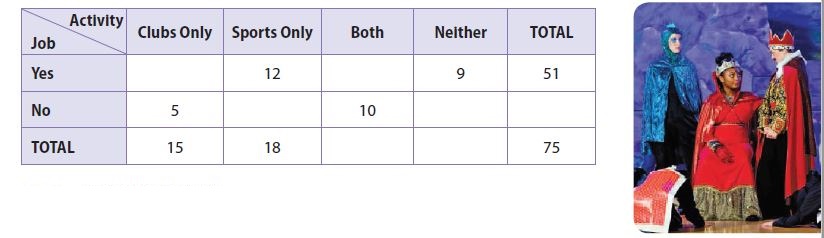
Question 3.
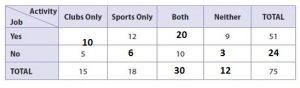
a. Complete the table.
Type below:
_______________
Answer:
Question 3.
b. Explain how you found the correct data to enter in the table.
Type below:
_______________
Answer:
1) In the first row of yes the values of sports only, Neither and total were provide. Also, in the 1st column of cubes only the values of No and total were providers. So, these values were subtracted and the value of yes was known.
2) The values in the 1st row of yes were added and subtracted from the total column. Hence the value in both columns was known. So, similarly, by adding and subtracting the values in the rows and columns the vacant values were known.
Question 4.
Create a two-way relative frequency table using decimals. Round to the nearest hundredth.
Type below:
_______________
Answer:
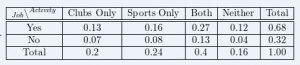
Explanation:
Using the frequency table in problem 3, divide each number in each cell by 75, the grand total, and round to the nearest hundredth.
Job and clubs only: 10/75 = 0.13
Job and sports only: 12/75 = 0.16
Job and both clubs not sports: 20/75 = 0.27
Job and neither clubs nor sports: 9/75 = 0.12
Job total: 51/75 = 0.68
No jobs and clubs only: 5/75 = 0.07
No Job and sports only: 6/75 = 0.08
No job and both clubs and sports: 10/75 = 0.13
No Job and neither clubs nor sports: 3/75 = 0.04
No Job total: 24/75 = 0.32
Clubs only total: 15/75 = 0.2
Sports only total: 18/75 = 0.24
Both clubs and sports total: 30/75 = 0.4
Neither clubs nor sports total: 12/75 = 0.16
Total: 75/75 = 1.00
Use the totals above to create a two-way frequency table.
Question 5.
Give each relative frequency as a percent.
a. the joint relative frequency of students surveyed who participate in school clubs only and have part-time jobs
_________ %
Answer:
13%
Explanation:
The joint relative frequency of students surveyed who participate in school clubs only and have part-time jobs 0.13 or 13%
(Job and clubs only: 10/75 = 0.13)
Question 5.
b. the marginal frequency of students surveyed who do not have a part-time job
_________ %
Answer:
32%
Explanation:
The marginal frequency of students surveyed who do not have a part time job is 0.32 or 32%
(No job total: 24/75 = 0.32)
Question 5.
c. the conditional relative frequency that a student surveyed participates in both school clubs and sports, given that the student has a part-time job
_________ %
Answer:
39%
Explanation:
The conditional relative frequency that a student surveyed participates in both school clubs and sports, given that the student has a part-time job is 0.39 or 39%
(20/51 = 0.39)
Two-Way Relative Frequency Tables – Page No. 464
Question 6.
Discuss possible influences of having a part-time job on participation in school activities. Support your response with an analysis of the data.
Type below:
_______________
Answer:
The joint relative frequency of students surveyed who participate in school activities and have part-time jobs is 0.27 or 27%.
The joint relative frequency of students surveyed who participate in school activities and do not have part-time jobs is 0.13 or 13%.
This means that the students who have jobs are more likely to participate in school activities than the students who do not have jobs.
FOCUS ON HIGHER ORDER THINKING
Question 7.
The head of quality control for a chair manufacturer collected data on the quality of two types of wood that the company grows on its tree farm. The table shows the acceptance and rejection data.
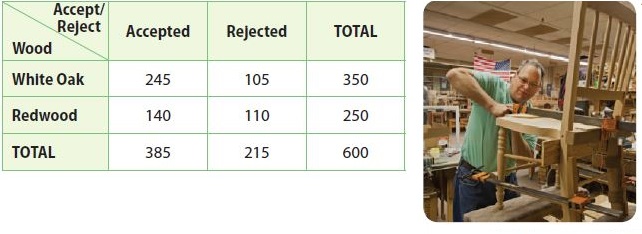
a. Critique Reasoning To create a two-way relative frequency table for this data, the head of quality control divided each number in each row by the row total. Is this correct? Explain.
_______________
Answer:
No, it is not correct for the head of quality control to divide each number in each row by the row total to create a two-way relative frequency table. Each data value should have been divided by 600, the grand total, not by the row total.
Question 7.
b. Draw Conclusions Are any of the data the head of quality control entered into the two-way relative frequency table correctly? If so, which is and which isn’t? Explain.
Type below:
_______________
Answer:
Since the head of quality control divided incorrectly, the top two rows are incorrect. However, the bottom row has correct data because each number in the bottom row was divide by the grand total.
Question 8.
Analyze Relationships What is the difference between relative frequency and conditional relative frequency?
Type below:
_______________
Answer:
Relative frequency is found by dividing a frequency by the grand total while conditional relative frequency is found by dividing a frequency that is not in the Total row or the Total column by the frequency’s row total or column total.
Ready to Go On? – Model Quiz – Page No. 465
15.1 Two-Way Frequency Tables
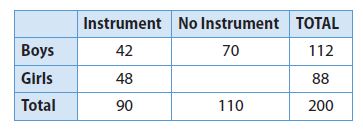
Martin collected data from students about whether they played a musical instrument. The table shows his results. Use the table for Exercises 1–4.
Question 1.
Of the students surveyed, how many played an instrument?
__________ students
Answer:
90 students
Explanation:
Of the students surveyed, 90 students played an instrument
Question 2.
How many girls surveyed did NOT play an instrument?
__________ girls
Answer:
40 girls
Explanation:
(No. of boys did not play a musical instrument) + (No.of girls did not play a musical instrument) = (Total no. of students did not play an instrument)
70 + x = 110
x = 40
So, the no. of girls did not play a musical instrument = 40.
Question 3.
What is the relative frequency of a student playing an instrument? Write the answer as a percent.
________ %
Answer:
45%
Explanation:
The relative frequency of a student playing an instrument in this case, 90 out of 200 students play a musical instrument
(90/200) . 100 = 45%
Question 4.
What is the relative frequency of playing an instrument among boys? Write the answer as a decimal.
________ %
Answer:
38%
Explanation:
the relative frequency of playing an instrument among boys
(42/112) . 100 = 37.5% or 38%
15.2 Two-Way Relative Frequency Tables
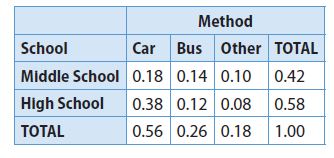
Students were asked how they traveled to school. The two-way relative frequency table shows the results. Use the table for Exercises 5–7. Write answers as decimals rounded to the nearest hundredth.
Question 5.
What is the joint relative frequency of high school students who ride the bus?
________
Answer:
The joint relative frequency of high school students who ride the bus is 0.12
Question 6.
What is the marginal relative frequency of students surveyed who are in middle school?
________
Answer:
The marginal frequency of students surveyed in middle school is 0.42
Question 7.
What is the conditional relative frequency that a student rides the bus, given that the student is in middle school?
________
Answer:
0.62
Explanation:
The conditional relative frequency that a student rides the bus given that the student is in middle school.
Total no. of students going to bus = 0.26
Students who ride the bus (who are a middle school) = 0.42
Conditional relative frequency = 0.26/0.42 = 0.62
ESSENTIAL QUESTION
Question 8.
How can you use two-way tables to solve real-world problems?
Type below:
_______________
Answer:
Accuracy in the calculation of the data as it maintains decently in a suitable format. It helps to measure each and every frequency easily as the values are placed individually. Also, helps to measure the total of each row and column separately. So, since the data represented is suitable it makes the person understand and solve the problem.
Selected Response – Mixed Review – Page No. 466
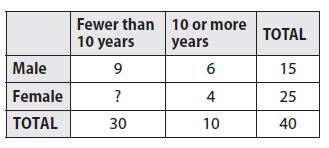
The table gives data on the length of time that teachers at Tenth Avenue School have taught. Use the table for Exercises 1–5.
Question 1.
How many female teachers have taught for fewer than 10 years?
Options:
a. 4
b. 9
c. 21
d. 30
Answer:
c. 21
Explanation:
(No. of male teachers who have taught fewer than 10 years) + (No. of female teachers who have taught fewer than 10 years) = 30
9 + x = 30
x = 21
The number of female teachers who have taught fewer than 10 years is 21.
Question 2.
What is the relative frequency of teachers who have taught for 10 or more years?
Options:
a. 10%
b. 25%
c. 30%
d. 60%
Answer:
b. 25%
Explanation:
The relative frequency of teachers who have taught more than 10 or more years.
Total no. of teachers = 40
No. of teachers who taught more than 10 years = 10
Relative frequency = (10/40) . 100 = 25%
Question 3.
What is the relative frequency of having taught for fewer than 10 years among male teachers?
Options:
a. 0.09
b. 0.225
c. 0.6
d. 1.50
Answer:
c. 0.6
Explanation:
The relative frequency of male teachers who have taught fewer than 10 or more years.
Total no. of teachers = 15
No. of male teachers who taught for fewer than 10 years = 9
Relative frequency = (9/15) = 0.6
Question 4.
What is the joint relative frequency of female teachers who have taught for more than 10 years?
Options:
a. 4%
b. 10%
c. 16%
d. 25%
Answer:
b. 10%
Explanation:
The relative frequency of female teachers who taught for more than 10 years is 4/40 = 1/10 = 0.1 × 100 to calculate the data in percentage
10%
Question 5.
What is the marginal relative frequency of teachers who are female?
Options:
a. 0.16
b. 0.25
c. 0.4
d. 0.625
Answer:
d. 0.625
Explanation:
The total no. of teachers who are female = 25
Total no. of teachers = 40
Marginal frequency = 25/40 = 0.625
Question 6.
A triangle has an exterior angle of x°. Which of the following represents the measure of the interior angle next to it?
Options:
a. (180 − x)°
b. (x − 180)°
c. (90 − x)°
d. (x − 90)°
Answer:
a. (180 − x)°
Explanation:
The triangle has an exterior angle of x°. Let that angle be Angle ACD. So, the angle next to it is
Angle ACD + Angle ACB = 180º
Angle ACB = (180 − x)°
Question 7.
What is the volume of a cone that has a diameter of 12 cm and a height of 4 cm? Use 3.14 for π and round to the nearest tenth.
Options:
a. 25.12 cm3
b. 602.88 cm3
c. 150.72 cm3
d. 1,808.64 cm3
Answer:
c. 150.72 cm3
Explanation:
Diameter = 12cm
Radius r = 6cm
height h = 4cm
So, the volume of the cone = 1/3 . π . r². h
= 1/3 . 6 . 6 . 4 . 3.14 = 150.72 cm³
Mini-Task
Question 8.
The table gives data on books read by members of the Summer Reading Club.
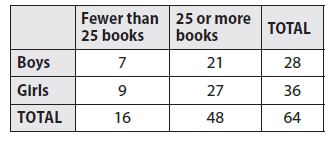
a. Find the relative frequency of a club member reading fewer than 25 books.
________ %
Answer:
25%
Explanation:
The relative frequency of a club member reading fewer than 25 books is
Total of 16 members read fewer than 25 books
16/64 = 0.25 or 25%
Question 8.
b. Find the relative frequency of reading fewer than 25 books among girl club members.
________ %
Answer:
14%
Explanation:
The relative frequency of a girl club member reading fewer than 25 books is
9/64 = 0.14 or 14%
Question 8.
c. Is there an association between being a girl and reading fewer than 25 books? Explain.
____________
Answer:
No, there isn’t any association between being a girl and reading fewer than 25 books. Because it is a choice depending on an individual to read as many books as he/she can and comparing with the boys reading fewer than 25 books because the number of girls reading these books is comparatively greater.
Conclusion:
Practice all the questions available on Go Math Grade 8 Answer Key Chapter 15 Two-Way Tables. Get your copy now to start your practice to be a part of the competition of maths exams. Go Math Grade 8 Answer Key is a great material that helps the students to learn in the best way.